Fuel Tracking – February 2016
February Gasoline Use and Statistics: *Assumes 10% ethanol for 17.68 lbs-CO2/gallon.
Read More
Cooling A Flask?
So, you have a flask (maybe it contains some chemical) and you want to cool the flask. The obvious answer is to place it in a refrigerator. However, you want to keep it on a magnetic stir plate, which every well stocked kitchen has on hand. You do have a few options, the first is…
Read MoreFuel Tracking – January 2016
January Gasoline Use and Statistics: *Assumes 10% ethanol for 17.68 lbs-CO2/gallon.
Read MoreFuel Tracking – December 2015
December Gasoline Use and Statistics: *Assumes 10% ethanol for 17.68 lbs-CO2/gallon.
Read MoreFuel Tracking – November 2015
November Gasoline Use and Statistics: *Assumes 10% ethanol for 17.68 lbs-CO2/gallon.
Read More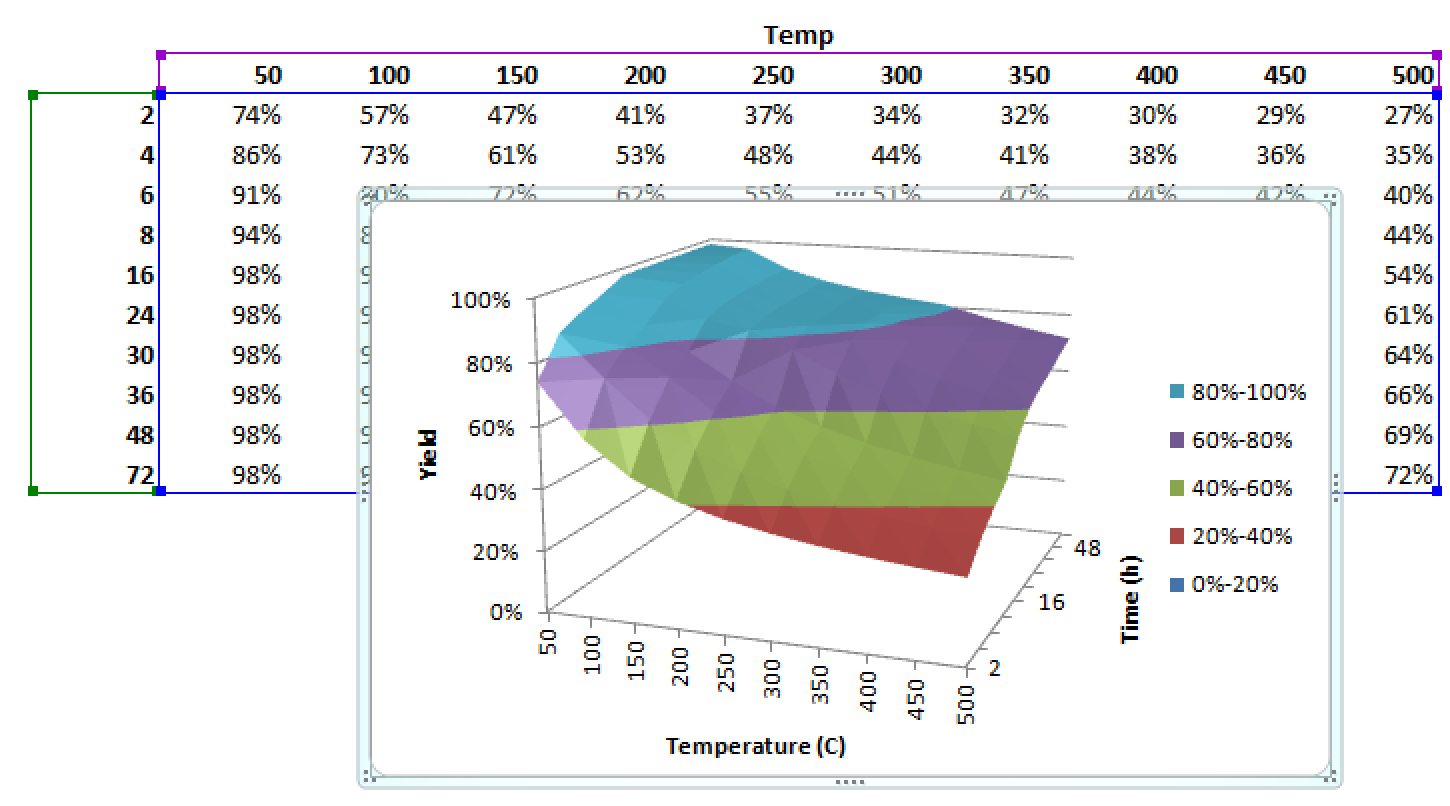
Excel Automation – VBA to Help Make Surface-Plots
Imagine that you have a complicated excel spreadsheet that might have more than one variable and calculates a numerical output. And, you would like to make a surface plot of the result as the two variables change. Surface plots are useful for displaying complicated data that tend to change a function of 2 or more parameters.…
Read More