TrueNAS Drive Monitoring with S.M.A.R.T Scripts, MySQL and Grafana
So, in this scenario, we are running TrueNas Core, which provides a ZFS filesystem for a network attached storage. We would like to have some warning and monitoring of the drives before they completely fail, a historical data collection feature, and a nice visual dashboard would be good too.
The Plan:
- A bash script will collect the latest SMART results and send them to a database.
- The script will run via crontab, and execute once per hour.
- MySQL will collect some of the key smart parameters
- Grafana will display the key metrics.
- Isolation is required
- The script will run in one FreeBSD Jail that can see the drives (high permissions)
- Mysql will run in a separate FreeBSD Jail (lower permission)
- Grafana will be installed in its own FreeBSD Jail using the standard plugin option
- Collect these smart paramters:
- General Info: Collection Time Stamp, Drive Model, Drive Serial Number
- Number of Sectors Relocated (indication of failing drive)
- Bytes Written & Bytes Read (wear rate based on 180 TB/yr for 3 year warranty)
- Operation Time (wear rate indicator for warranty period of 3 years).
Part 1: Create a MySQL Database
Let’s Start with a New MySQL database server.
Create a new Jail using the standard wizard. There isn’t anything special about this jail.


Start the Jail
Enter the SHELL
Install MySQL Server: pkg install mysql84-server
Enable the server to autostart: sysrc mysql_enable=“YES”
Start the server manually the first time: service mysql-server start
Setup the mysql server with: mysql_secure_installation
— This will enable you to specify the root password, clear the example tables, and remove other users
Login to the server with: mysql -u root -p
It will prompt you for the root password
I use MySQL Workbench to manage the database.
I first create a new user for myself… by entering this directly into the mysql.
Grant All permissions with the ability to grant new accounts. Basically a admin role. This is not what you will use to connect to the database later. We need to make a sub-account for the script and for Grafana. This makes a new user for me, and attaches it to my computer’s network IP address and assigns me a password for the password manager. Replace the *** with your actual IP address.
CREATE USER ’nick’@‘192.168.***.***’ IDENTIFIED BY ‘PASSWORD’;GRANT ALL ON *.* TO ’nick'@‘192.168.***.***’ WITH GRANT OPTION;FLUSH PRIVILEGES;
We will need to come back here later… as we don’t have the IP address of the Script Hosting Jail yet.
But later, we will use this command to create a new account for the script.
CREATE USER 'script’@’IP ADDRESS OF SCRIPTRUNNER' IDENTIFIED BY ‘Password';
GRANT ALL ON *.* TO 'script'@‘192.168.1.204';
FLUSH PRIVIEGES;
NOTE: All of this assumes that you have static IP addresses. The network router I use will apply a fixed IP address to each device (and virtual device) that connects to the network. I use these addresses here. You probably need to login to your router and fix the IP address.
Part 2: Create the Script and Host
We start with a new Jail in TrueNas

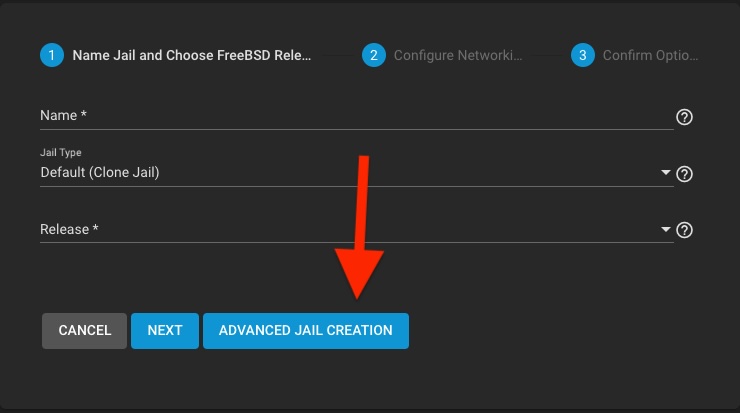
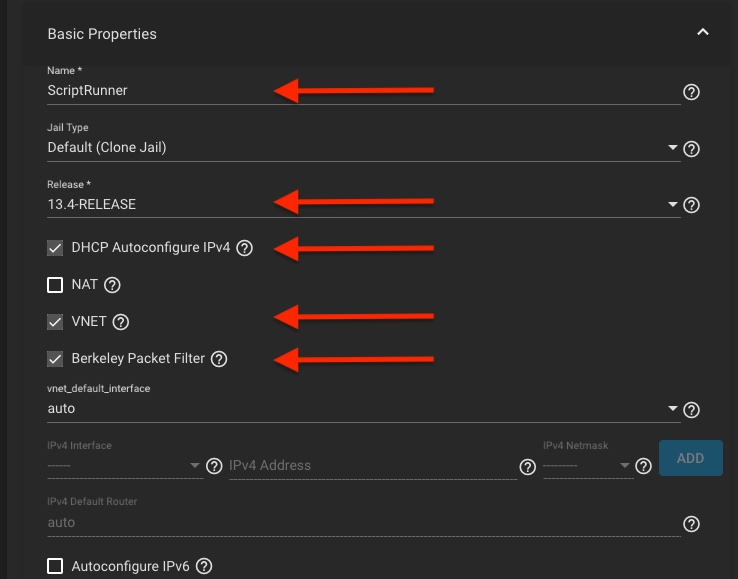

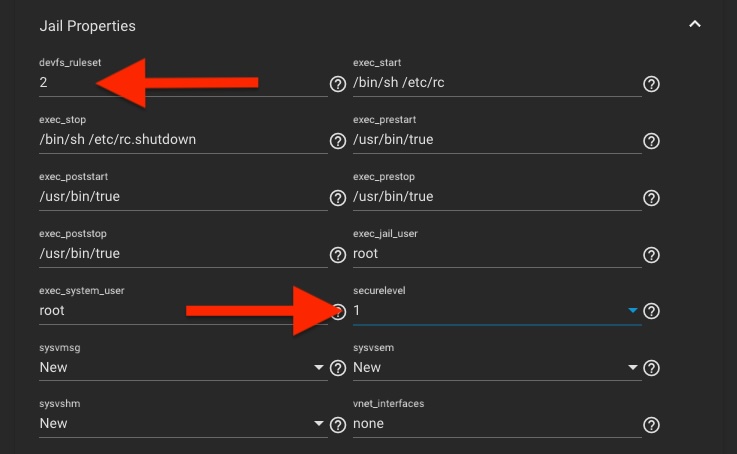
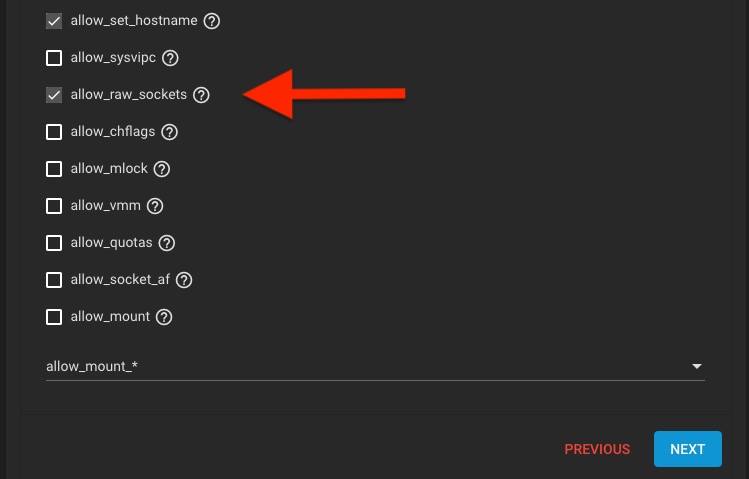


Run the Following to install the editor, bash shell, mysql client, and smart tools
pkg install nanopkg install bashpkg install mysql84-clientpkg install smartmontools
Now let’s create the script.
Run: nano smartscript
Edit the new file with script code.
A sample copy is hosted here on my GitHub

This script seems simple but requires a bit of understanding the smartctrl output format and commands.
Begin by putting in your MySQL parameters from Part 1.
disks=$(sysctl -n kern.disks) will ask the system
It will use sysctl -n kern.disks to get a list of disk drives installed
Then, it will iterate over each disk:
Call smartctl -x to receive a detailed report for that disk and store entire report to a variable.
Then, parse the data with grep | awk to isolate the values and store to vars.
Need to add a different line for each variable we want to store from the smartctl.
For example, to get the drive serial number:sn=$(echo "$smart_output" | grep "Serial" | awk '{print $3}' | xargs)
Find the line with with the word “Serial” in it then pull out column 3 and store in SN variable
Finally, we add the data into the database: mysql -h $MYSQL_HOST -u $MYSQL_USER -p$MYSQL_PASS -D $MYSQL_DB -e "INSERT INTO SMART (Model, SN, Time, Start_Stop_Count, Reallocated_Sector_Ct, Power_On_Hours, Power_Cycle_Count, Load_Cycle_Count, Offline_Uncorrectable, Current_Pending_Sector, Multi_Zone_Error_Rate, Logical_Sectors_Written, Logical_Sectors_Read, Iface) VALUES ('$dev_model', '$sn', '$time', '$(($Start_Stop_Count))', '$(($Reallocated_Sector_Ct))', '$(($Power_On_Hours))', '$(($Power_Cycle_Count))', '$(($Load_Cycle_Count))', '$(($Offline_Uncorrectable))', '$(($Current_Pending_Sector))', '$(($Multi_Zone_Error_Rate))', '$(($Logical_Sectors_Written))', '$(($Logical_Sectors_Read))', '$disk');
Now make the script an executable by typing: chmod +x smartscript
NEXT – Go back to the MqSQL database jail and create the script user, and include the ip address of the jail that is holding the script operations.
THEN – (almost done) – You need to create the table in the database.
I used MySQL workbench to create the table columns:
CREATE TABLE SMART (
Model varchar(255),
SN varchar(255),
Time datetime,
Raw_Read_Error_Rate int,
Start_Stop_Count int,
Reallocated_Sector_Ct int,
Seek_Error_Rate int,
Power_On_Hours int,
Power_Cycle_Count int,
Load_Cycle_Count int,
Reallocated_Event_Count int,
Offline_Uncorrectable int,
Current_Pending_Sector int,
Multi_Zone_Error_Rate int,
Logical_Sectors_Written bigint,
Logical_Sectors_Read bigint,
Num_Uncorrectable_Errors int,
Iface varchar(255)
);
Finally – Setup the crontab to run the script on a regular basis.
Use command: contab -e to enter the editor and enter something like this:

To type in this editor, PRESS the i key to enter insert mode. Press ESC to stop editing, then :w to write the changes and :q to exit.
Test the script by using the ./smartscript command. It should give some complaints about having passwords in the command line. One complaint for each drive of data. But otherwise should be error free.

If all goes correctly the database will look like this example.
Where you have the fields listed and some initial data:

Part 3: Visualize the Data
Let’s setup the Grafana Plugin:
Click on Plugins, then Select Community Collection, then Click Grafana, Finally Install. Give it a nice name and click Save. It will then do the install for you. And… it will even give you incorrect post install notes.

Navigate to the Admin Portal that it provided. Your IP address for the Jail/Plugin will be different. Figure that we’ve got 3 different IP addresses for this project running in 3 different jails.


The Post Install Gives a Fake Password… If it doesn’t work. Try this:
Username = admin
Password = admin
Then reset the password to whatever you want.
Let’s connect our database:
Before we get started… I’m going to help you skip ahead a bit. There is a security issue with Grafana and SQL. It gives you this warning:

So, now that we have our newly created Grafana installation and its IP address. We can create a grafana user for our database. Go back to the MySQL jail shell, enter the mysql shell like before and create a restricted user.
mysql -u root -p
It will prompt you for the root passwordCREATE USER ’grafana'@‘192.168.***.***' IDENTIFIED BY ‘PASSWORD’;GRANT SELECT ON smart.* TO ’grafana'@‘192.168.***.***’;FLUSH PRIVILEGES;
This makes a new user for Grafana, and attaches it to that jail’s network IP address, and assigns a password to that connection. Use the IP address for the Grafana install and the password you selected. And, only assigns the SELECT commands (IE: Read only).
Back to Grafana:
Going under the menu on the top left, clicking Connections and Connect data.
Then, search for MySQL, Click on MySQL, Click Create a MySQL data source.


Give it a Name, Enter the IP Address of the Jail hosting the MySQL database server, enter the database name that you created in part 2, and… finally enter the username and password you just made.


Make a new Dashboard!
Click Home, Dashboards, New


Choose the fields to display, then click Run query to fetch the data.


Switch to Transform Tab. Add a Grouping to Matrix Option. Now, group by Serial Number, with each row being a time entry, and each cell in that row holding the Reallocated Sector Count.


Repeat for Other Display Options!

There is some math going on here for the RunTime Life (hrs). Each drive is estimated good for only 3 years of powered on time. So, we do that math using “Add Field from Calculation” Transformations. We need to divide the power on hours by 8760 to get it to years, then divide that by 3 to give fraction of life time (based on warranty), then multiply by 100 to get to a normalized percent for the display. Each of these are a step before we do the matrix grouping.

Likewise, the TBW indicator of wear life is the same. Use Transformations to convert the Logical Sectors into bytes by multiplying by 512 (which is how smart reports the sectors – even if the disk is native 4k). Then we divide by the total number of bytes in a Terabyte.

That about Concludes this very long tutorial…
I’ve been looking for ways to track hard drive failures (and later cost) operating on premise file servers… Oddly enough, in building this example, I discovered that an older (7 year old) Segate ST8000VN0022 drive starting to relocate damaged sectors. Might be time to replace it. The goal will be to roll this monitoring out to other systems and try to monitor drive stats. When drives have been moved between systems and projects with some drives surviving over 7+ years it was becoming difficult to predict their life expectancy. Side note: newer drives seem to die right after the 3 year warranty.

