2016 – Year End Economic Review
Data Log Everything…
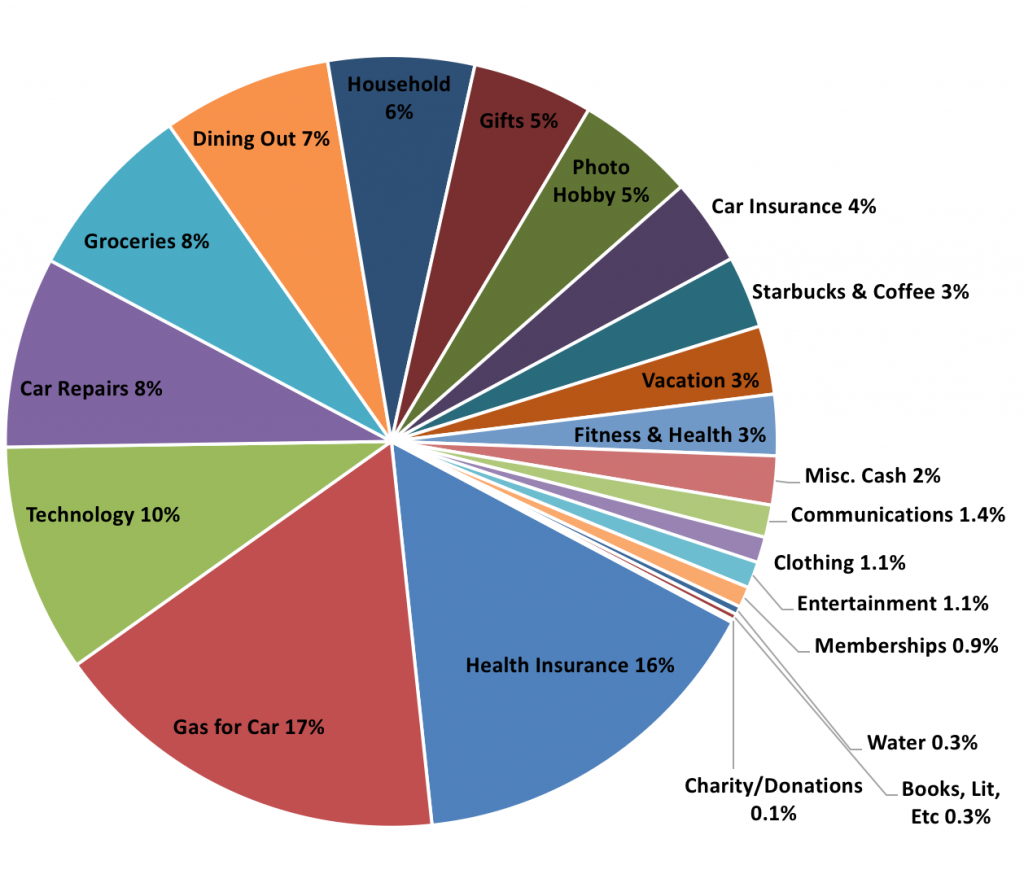
2016 ended and we now review how the savings & spending went. Like any stereotypical older millennial, borderline traditionalist, that experienced an economic crash, we save as much as possible and try to spend in the most responsible method imaginable. This means not living on my own, avoiding a car loan payment by keeping the old clunker running, and trying to plan for retirement… Yes, spending 46% of my income on goods and services (insurance), squirreling away 38% for when I am old (or to lose in the markets), and keeping the rest for a rainy day and/or paying off any debts; this year turned out boring and financially responsible.
- Interesting: Using the Amazon Prime membership, 30% of all tangible goods and services (not insurance) went through Amazon. Including the membership cost, this had a net savings of $213 for the year when compared to purchasing the same items from a local store. Oddly enough, average prices were about 15% lower from January through November, then flipped to being 13% more expensive during December. Most of this reversal was caused by 3rd party vendors offering faster Prime shipping and charging a premium for the item. Goals: Next year, don’t wait until middle of December to do holiday shopping.
- Health Insurance reached 16% of all expenses. Annoying… considering that I haven’t used the insurance since 2010. Over 6 years, the monthly premium has gone up by about 104% (yet only 2% over last year).
- Priorities… Tech gadgets (ChromeCast, Arduino, 3D Printer, Photo printer, etc) consumed as many resources as Food.
- I spent twice as much money on Coffee as I did on Cell Phone service.
- Did I go on Vacation this year? Not that I can remember. Spending was down 81% over last year.
- And, Car Repairs were up by 31% as compared to 2015 (must have been those new tires and dead battery).
New Year’s Resolutions for 2017:
1. Reduce tech gadget spending
2. Increase coupon use
3. Increase the vacation allocation!
4. Drink less coffee 🙂
— Happy New Year!